GeoPrior-3.0 Forecaster
A guided desktop environment for operationalizing GeoPrior-v3 from data intake to reproducible geohazard forecasting.
- 19
- interface screens
- 4
- core workflow stages
- 1
- desktop layer over GeoPrior-v3
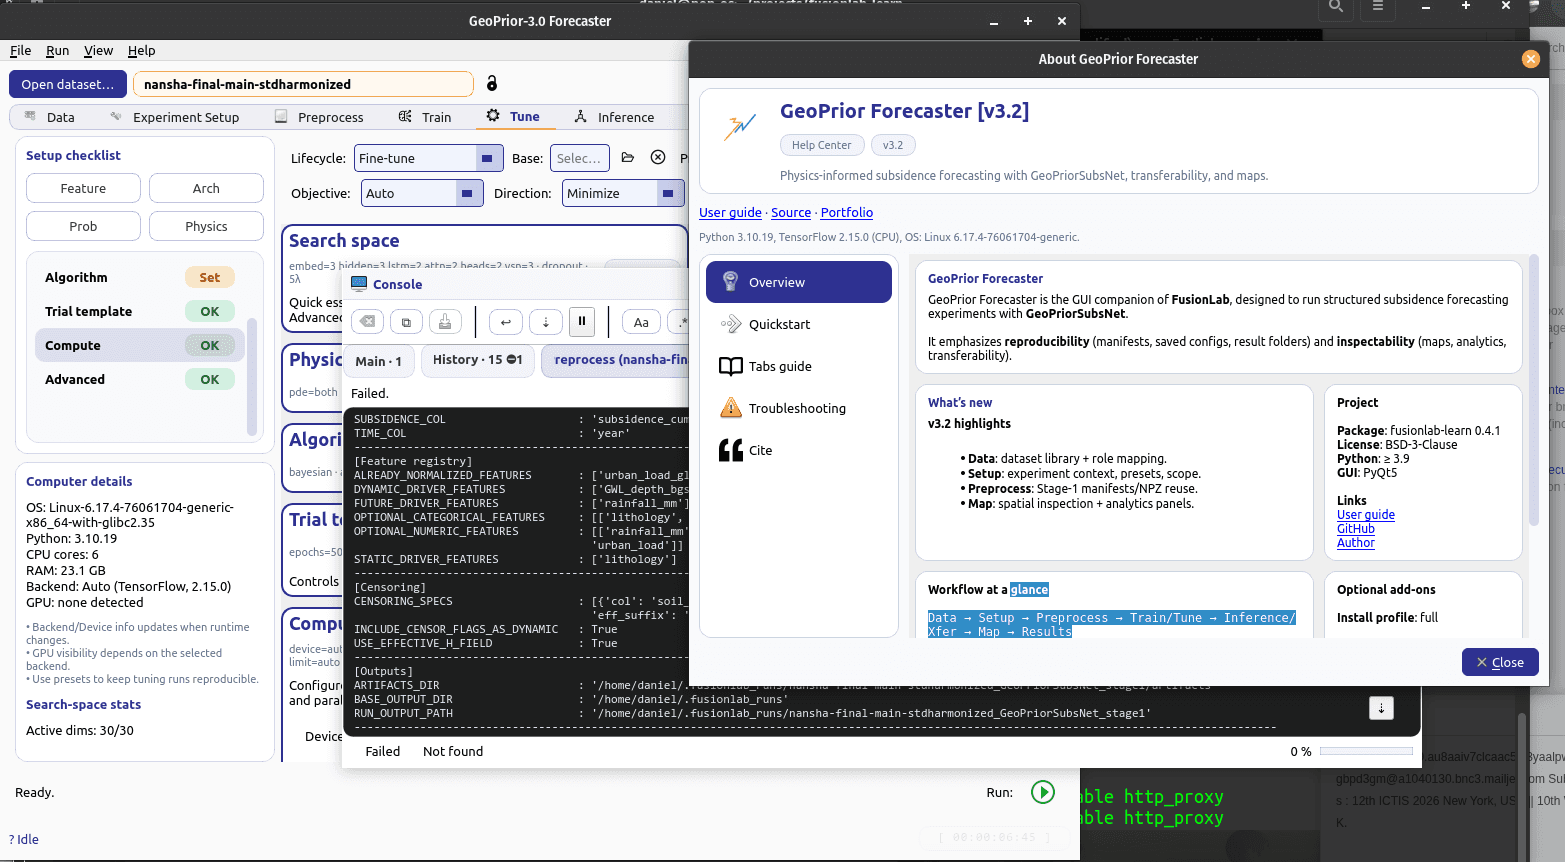
Le voir en action
Regardez GeoPrior-3.0 Forecaster projeter la subsidence jusqu'en 2032, puis suivez le workflow complet et le transfert d'un modèle d'une ville à une autre.

Land subsidence simulation
A short visual simulation showing how land subsidence could evolve from 2020 to 2032 under a business-as-usual scenario, helping decision-makers see where risk concentrates and why early action matters.
Voir sur YouTube Tutorial
GeoPrior-v3 tutorial walkthrough
A deeper walkthrough of the forecasting workflow, from guided setup to model execution inside the desktop product experience.
Voir sur YouTube Deep diveEn français
Transferability across cities
A focused explanation of how a model trained in one city can support another city instead of forcing every deployment to restart from zero.
Voir sur YouTube
Conçu pour la prévision opérationnelle
Chaque hypothèse, paramètre physique et choix de modèle reste visible : les résultats sont plus faciles à vérifier, à relire et à partager.
Pour qui
- 1Research labs that want reproducible setup without command-line friction.
- 2Applied geohazard teams preparing land-subsidence scenarios and transfer runs.
- 3Project leads who need model assumptions, physics settings, and outputs visible in one place.
Guided setup surfaces
Move through project paths, coordinate systems, data semantics, scaling, and feature registration with explicit UI checkpoints.
Physics-aware configuration
Keep architecture settings, censor-aware thickness handling, and physics constraints visible instead of hidden in scripts.
Operational workflow tabs
Data, experiment setup, and preprocessing views keep the end-to-end forecasting pipeline legible for teams.
Transfer and tuning ready
Support repeated experiments, model tuning, and transfer workflows in a desktop-first product layer.
Des données brutes à la prévision en quatre étapes
Un parcours guidé qui garde chaque réglage visible, du premier jeu de données à la prévision finale.
- 1
Ingest and align data
Start from project paths, coordinate reference systems, and semantic setup so every run begins from a clean contract.
- 2
Design the experiment
Define time windows, scaling units, feature registries, and architecture settings from dedicated setup dialogs.
- 3
Apply preprocessing controls
Handle censoring, physics constraints, and device/runtime options before training begins.
- 4
Train, tune, and forecast
Run forecasting workflows with a UI that keeps probabilities, experiment state, and decision points visible.
Au cœur de l'application
Trois espaces de travail essentiels : explorer vos données, concevoir l'expérience et contrôler le prétraitement.
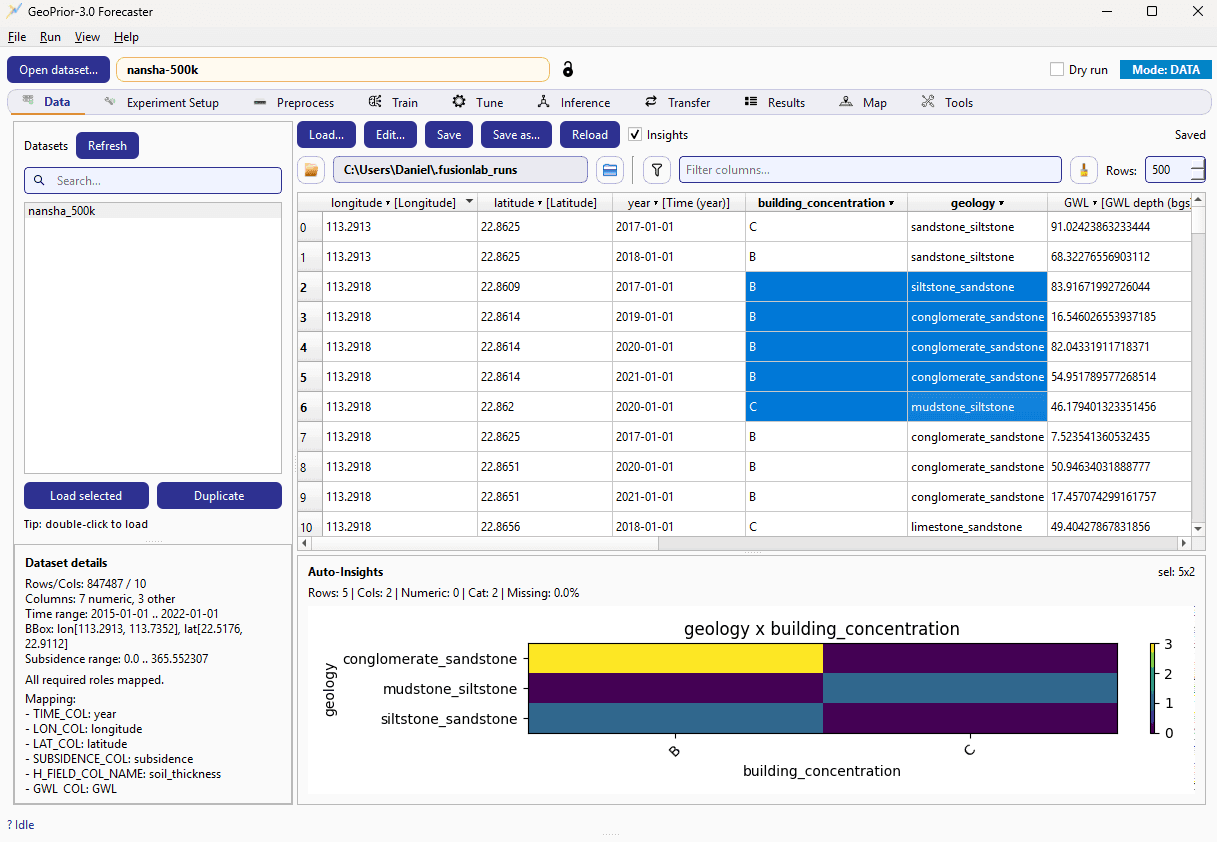
Data workspace
Load a city dataset, inspect every column, and read automatic insights before any modelling starts.
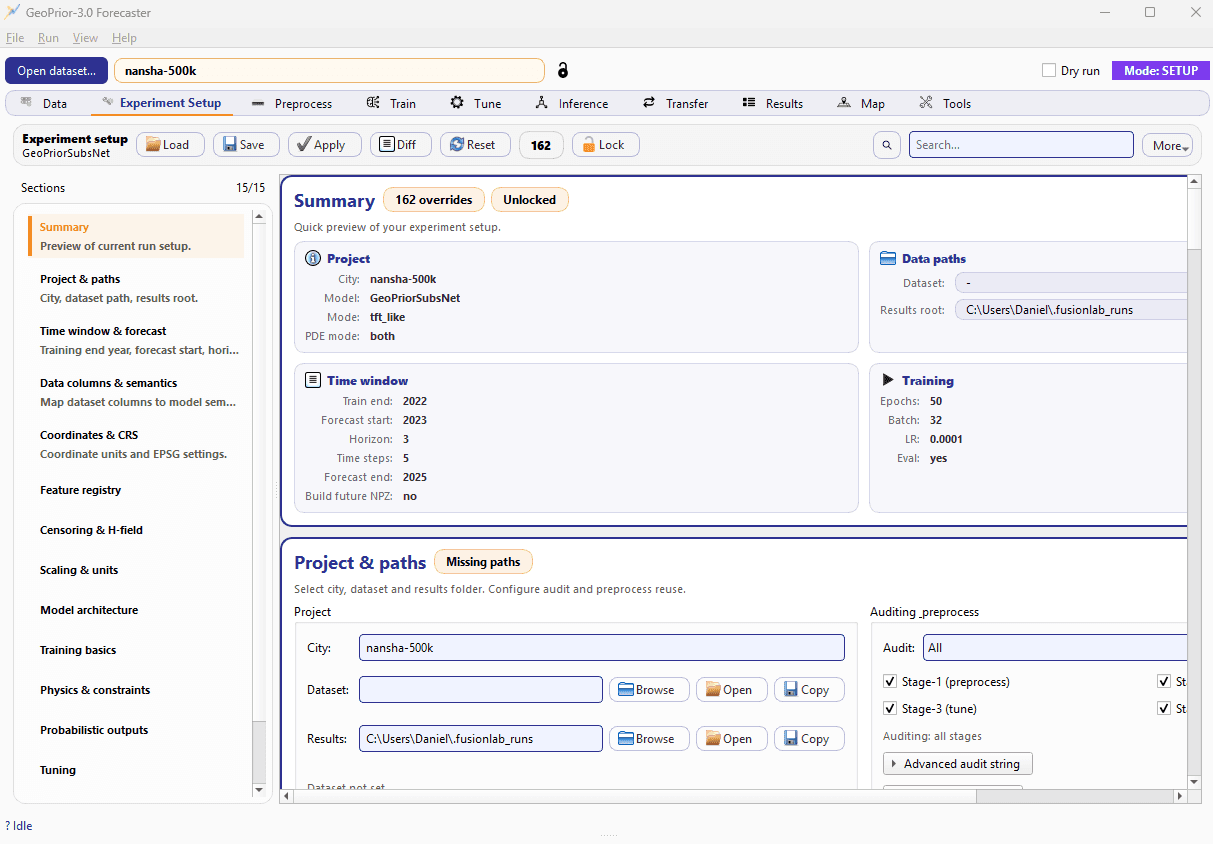
Experiment design
A dedicated setup view for architecture, time windows, feature choices, and run definition.
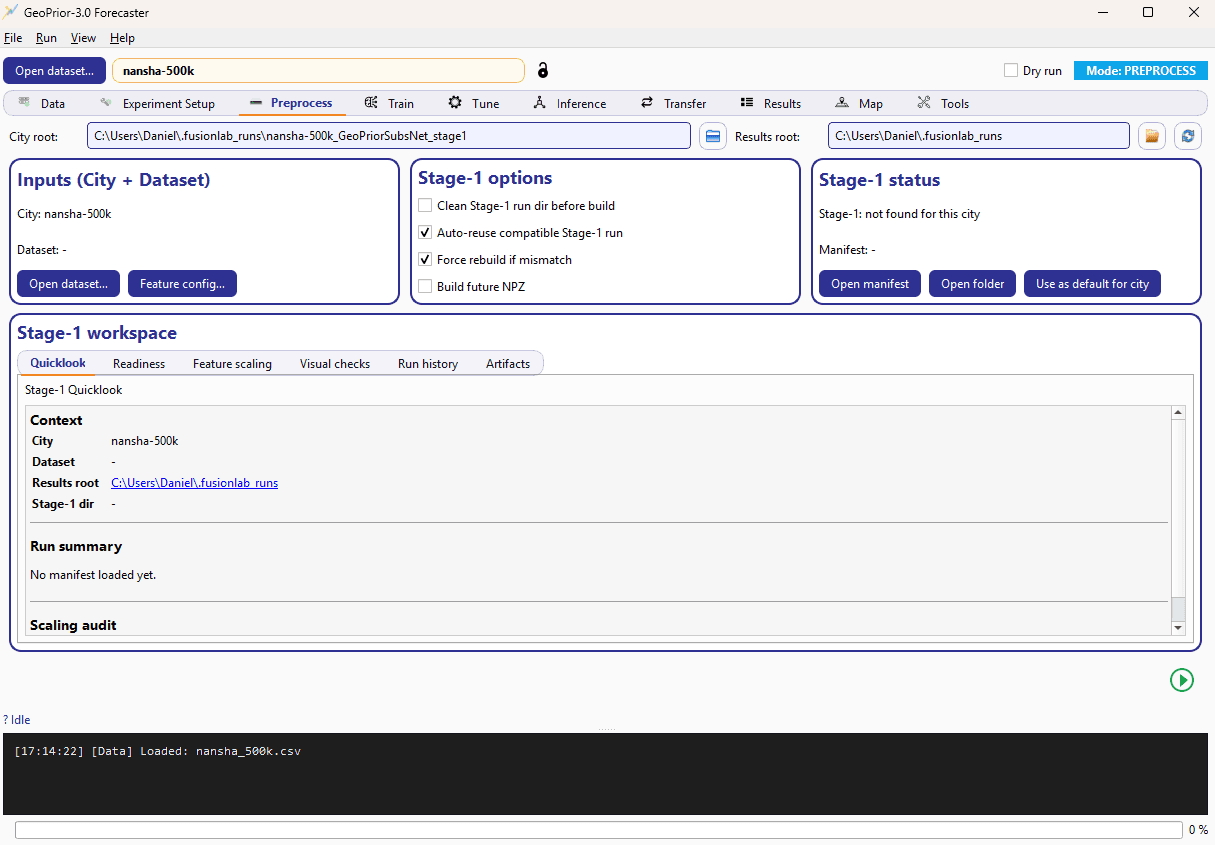
Preprocess control
A visible preparation layer for data harmonization before model execution.
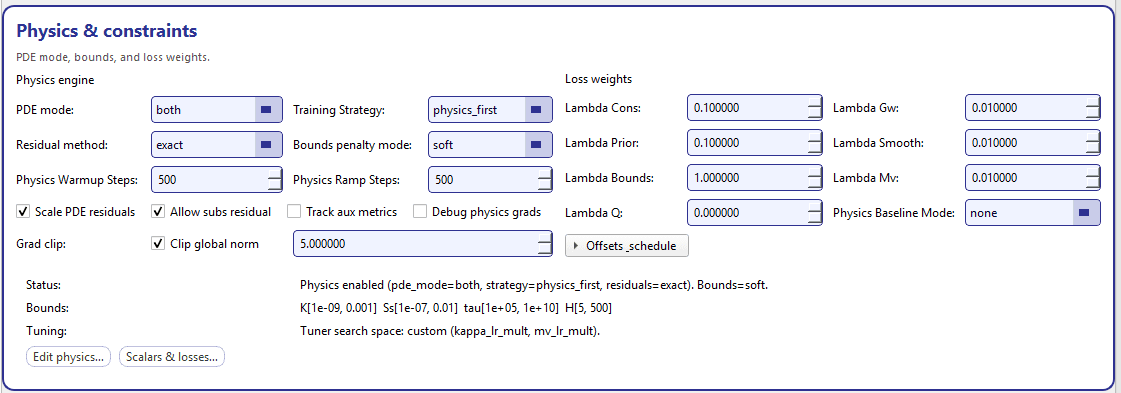
Physics constraints
Choose the PDE mode, residuals, bounds and loss weights that keep every forecast physically consistent.
Démo ville
Envie de discuter d'un vrai cas d'usage en résilience urbaine ?
Une démo centrée sur une ville va plus loin : où se concentre le risque de subsidence, comment évoluent les scénarios et ce que cela implique pour la planification.